18A01: Exam Report
Describe the carriage of oxygen in the blood, including total oxygen delivery per minute.
32% of candidates passed this question.
Better answers divided oxygen carriage into that bound to haemoglobin and that carried in the dissolved form. A reasonable amount of detail on the haemoglobin structure and its binding of oxygen was expected, including an explanation of co-operative binding and the oxygen carrying capacity of haemoglobin. Better answers mentioned Henry’s law in the description of dissolved oxygen, along with an estimation of the amount of oxygen that is normally in the dissolved form.
It was expected that answers include the equation for oxygen delivery, a brief description of the components of that equation and the normal value, which a large number of candidates omitted.
F8i / 18A01: Describe the carriage of oxygen in blood, including total oxygen delivery per minute
- O2 is carried in blood in 2 forms → dissolved & oxyhaemoglobin
Dissolved O2
- The O2 carried in physical solution
- Obeys Henry’s Law
HENRY’S LAW: the amount of dissolved gas present in solution is directly ∝ to the partial pressure
- Solubility coefficient for O2 = 0.003mL/dL at 37°C
Dissolved O2 (mL/100mL) = PaO2 x 0.003 (mL/100mL/mmHg)
∴@ PaO2 100mmHg = 100 x 0.003
= 0.3mL/dL
→ This is 1% of carried O2
NB: Dissolved PO2 rises with ↓ temperature
Oxyhaemoglobin
- Binds reversibly to Hb → Hb + O2 ⮂ HbO2
- OXYGEN CAPACITY: maximum amount of O2 that can combine 1g Hb
Huffner’s Constant = 1.34mL O2 per 1g Hb
∴O2 CAPACITY (mL/100mL) = Hb (g/mL) x 1.34 (mL/g)
∴Hb 15g/dL = 20.1mL O2 / 100mL blood
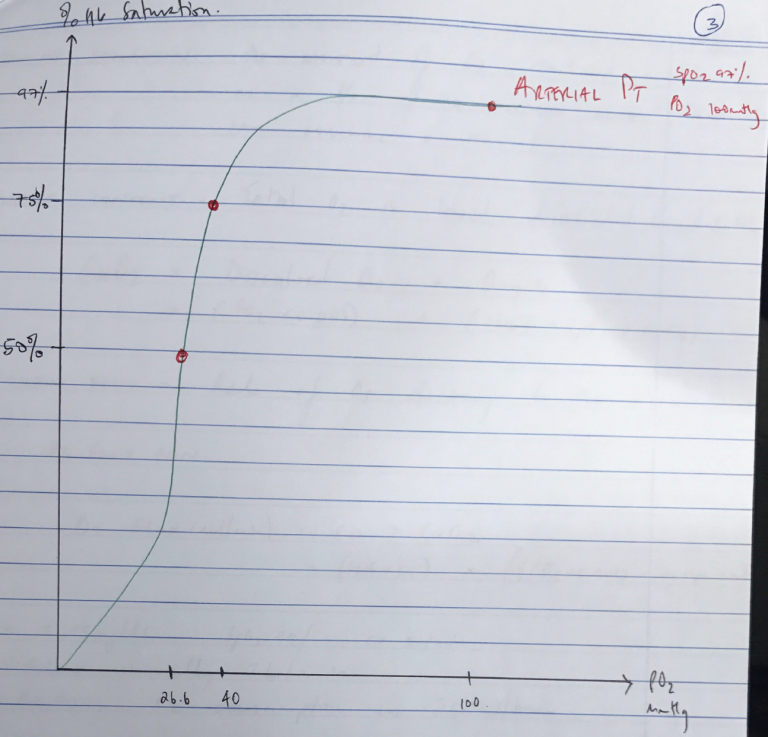
Oxygen Dissociation Curve
- Describes relationship b/w PO2 and % saturation of Hb with O2
- Curve is Sigmoid Shape due to +VE COOPERATIVITY
- Affinity for O2 lowest when first molecule binds ‘TENSE’ deoxyHb
- As each subsequent molecule binds, gradient of the curve ↑
- As PO2 ↑, all the Hb – O2 binding sites become occupied, and the curve levels off
- Important points on O2 – Hb Dissociation Curve
- Arterial Blood → 100mmHg; 97.5%
- ICU point → 60mmHg; 91%
- Mixed Venous Point → 40mmHg; 75%
- P50 → 26.6mmHg; 50%
- Arterial blood PO2 100mmHg = SpO2 100%
→ Carries 20mL O2 / 100mL blood
↓ (tissue capillaries)
→ 5mL O2/100mL blood removed for aerobic metabolism
↓
→ Mixed venous blood = 15mL/100mL blood PO2 = 40mmHg → SpO2 75%
- Different factors can ∆ position of the curve & P50 is used as a reference point for this
P50 = measure of O2 affinity
←L) Shift
↑pH
↓2,3 DPG
↑↓ Temp
↓PO2
R) Shift →
↓pH
↑2,3 DPG
↑Temp
↑PCO2
- BOHR EFFECT: at ↑PCO2 & low pH Hb has less affinity for O2 & offloads it easily
- OXYGEN SATURATION: the amount of O2 combined with Hb as a % of the maximum amount that can combine with Hb
- OXYGEN CONTENT: Total O2 in blood dissolved & bound to Hb
CaO2 = Dissolved O2 + OxyHb = (PO2 x 0.003) + ([Hb] x SpO2 x 1.34)
- OXYGEN FLUX: Rate of O2 delivery to the tissues
O2 Flux (mL/min) = CO x CaO2
= (HR x SV) x [(PO2 x 0.003) + (Hb x SpO2 x 1.34)]
- Hb = 15mg/dL, SpO2 99%, CO 5L/min
- Flux usually 1L/min
- Resting O2 consumption is 250mL/min
