G2iii: CVS Electrical Syllabus: Cardiac Cycle
- Cardiac cycle = one complete sequence of ventricular systole & diastole (At HR 72bpm, CC takes 0.8sec → diagram)
- The CARDIAC CYCLE DIAGRAM (aka Wigger’s diagram) depics the L) side of the heart over time
- It is a graph of these events over time
Pressure
LV P
Aortic P
Atrial P
Volume
LV vol
Electrical
ECG
- Events of systole: IVC, rapid ejection, reduced ejection, IVR
- Events of diastole: rapid filling, reduced filling, atrial systole
Isovolumetric Contraction
- AV & SL valves shut → no volume ∆
- ECG: peak of R wave → ventricular depol. → myocyte contraction
- Atrial P: bulging of MV into LA → ↑atrial P = c wave
- LV P: rapid rise in LVP > atrial P = MV closes
- Aortic P: decreasing as blood going out to peripheries
- LV vol: no change
- Aortic BF: minimal
Rapid Ejection
- LV P > AoP = opening SL valves
- Ejection of blood occurs because Total E of blood in LV exceeds Total E of blood in Aorta
- Total E of blood = Pressure Energy + Kinetic E
- ECG: isoelectric ST segment
- Atrial P: no descent, ↓LAP because of atrial stretching, despite MV shut & atria filling
- LV P: ↑LVP
- AoP: ↑AoP
- LV P > AoP → AoV opens → blood ejected
- LVP at slightly higher P to depict P grad required for forward flow of blood
- LV vol: rapid ↓ as blood ejected into Aorta
- Aortic BP: rapid ↑ Aortic BF, highest when LVP & AoP intersect
Reduced Ejection
- ECG: T wave = ventricular repol. = ↓ventricle tension
- LAP: progressive ↑LAP as blood filling atria
- LVP: ↓as large vol. of blood has been ejected
- AoP: AoP cont. to rise slightly, exceeding LVP due to stored potential E. in stretched arterial wall & then AoP falls as blood runs off to peripheries
- LV Vol: ↓but less quickly as LVP ↓
- Aortic BF: outward flow still occurring due to Kinetic E. of blood propelling blood forward, but ↓as AoP > LVP
- End of this phase concludes systole
- Aortic BF reverses → AoV shuts
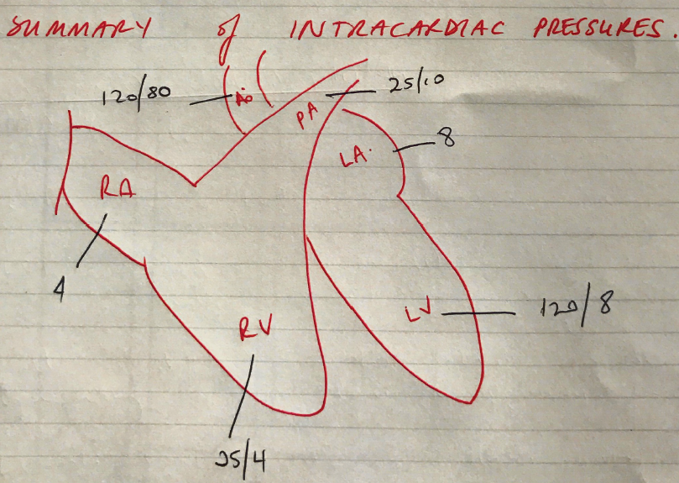
- End Systolic Vol = 50mL
- End Diastolic Vol = 120mL
- ∴EjF ~ > 0.55 = normal
Isovolumetric Relaxation
- Closure of SL valve until AV valve opens
- ECG: end of Tw, ventricular repolarisation
- LAP: v-wave, peak in atrial P as AV valves still closed
- LVP: rapid ↓ to baseline as all valves closed
- AoP: flow reversal curves AoV shut & dicrotic notch
- There, kinetic E of retrograde flow is converted into potential (pressure) E when closed AoV is met
- Aortic does not drop drastically like LVP because there is potential stored E in the elastic walls & SVR tone impedes all blood flowing out to distributing arterioles immediately
- LV Vol: no change. ESV = 50mL
- Aortic flow: remains low, no LV ejection & blood moving out to peripheries
Rapid Filling
- LAP > LVP → AV valve opens
- ECG: isoelectric
- LAP: y descent, atria empty, LAP ↓
- LVP: ventricular P ↓ despite filling because of ongoing ventricular relaxation
- AoP: falling through diastole
- LV vol: rapid ↑, 60% of ventricular filling
(Diastasis) Reduced Filling
- ECG: isoelectric
- LAP: follows LVP, gradual rise
- LVP: gradual rise (v. small) as blood filling a fully relaxed ventricle
- Small P difference between LAP & LVP indicate AV valves, representing a very low R pathway for blood flow
- LV vol: ↑ but at slower rate
Atrial Systole
- ECG: p wave complete → atrial depolarisation & ∴atrial myocyte contraction
- Beginning of QR
- LAP: a wave, ↑ P from atrial systole, followed by y descent
- LVP: ↑with ↑blood flow
- AoP: still declining in ventricular diastole
- LV vol: ↑LV vol. (atrial kick = 30% filling)
- EDV = 120mL
- EDP = 8 mmHg
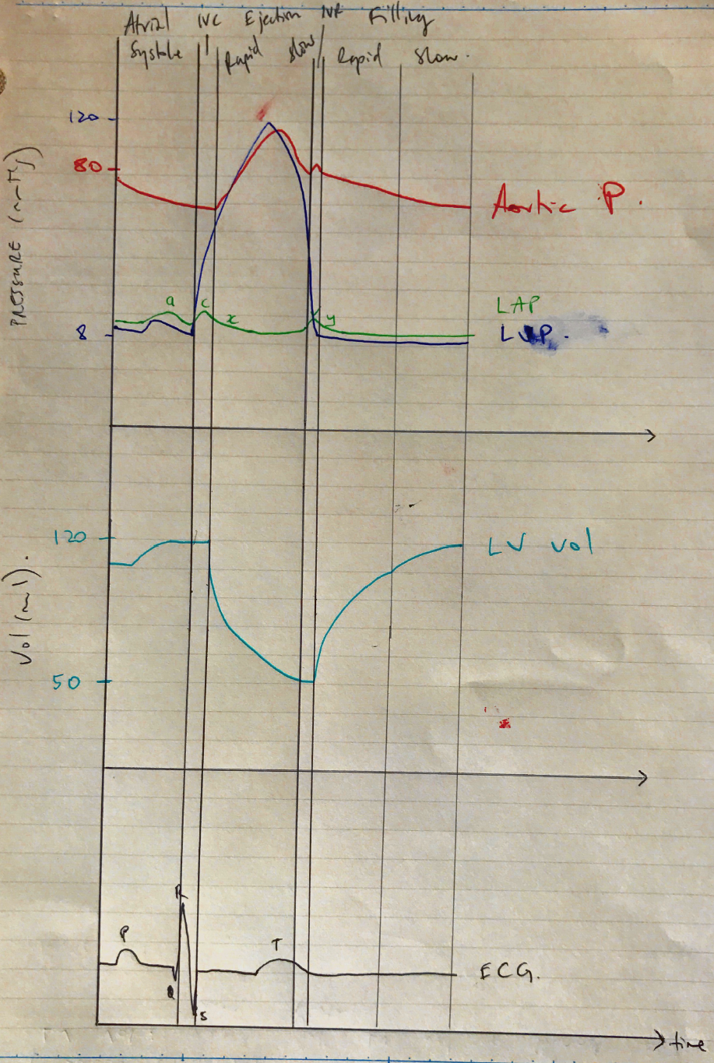
Wigger’s Cardiac Cycle