G3v: Describe and explain cardiac output curves, vascular function curves and their correlation
Vascular function curves (VR vs RAP) & Cardiac function curves (CO vs RAP) are used to demonstrate how systemic vascular function affects systemic blood flow
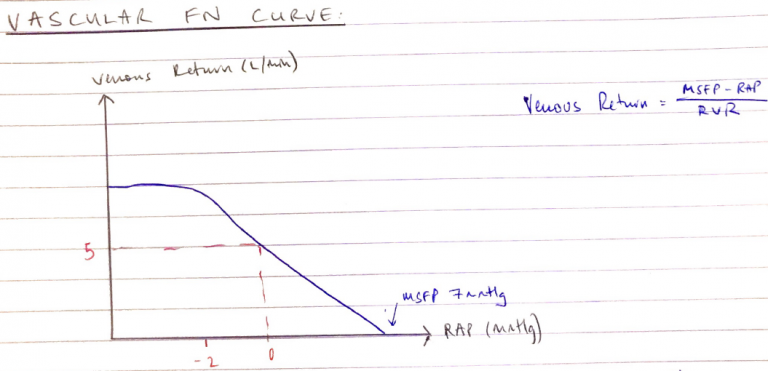
Vascular Function Curve
Affected by 3 factors:
Factors
Normally
MSFP
7mmHg
RAP
0mmHg
Resistance to VR
1.4mmHg
These normal values give VR = 5L/min → gives CO = 5L/min
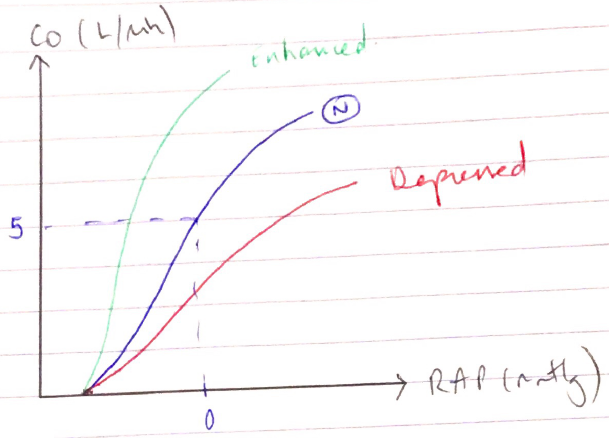
Cardiac Function Curve
According to F – S → ↑RAP = ↑CO
Cardiac function curve is similar to the other F – S curve (SV vs LVEDP)
Cardiac function curves are a family, there is no single curve → the change depending on the dependent variables
CO = HR x SV (preL/C/afterL)
∴Dependent variables = HR, preL, afterL, C
NB: RAP = THE INDEPENDENT VARIABLE
Normal cardiac function curve: CO = 5L/min & RAP 0mmHg
↑HR, ↑preL, ↑C, ↓afterL → ↑CO
∴cardiac function curve shifts up & LEFT
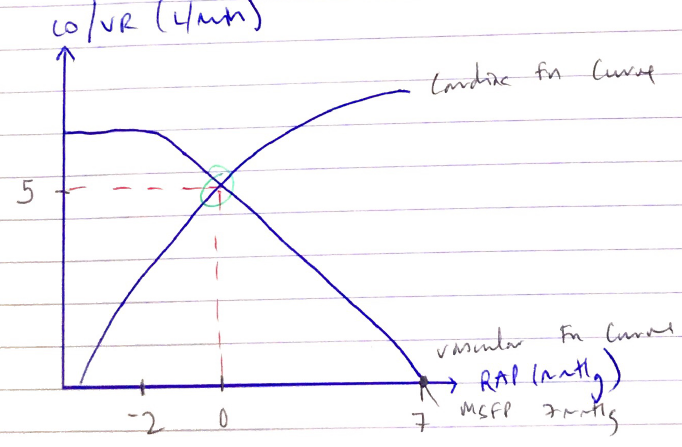
Interaction: Of Vascular Function Curves & Cardiac Function Curves
Superimposing the 2 curves → KA COUPLING between the Heart & peripheral circulation
The point where 2 curves cross → KA EQUILIBRIUM POINT, which defines at what CO & RAP the cardiovascular system is operating