17A23: Exam Report
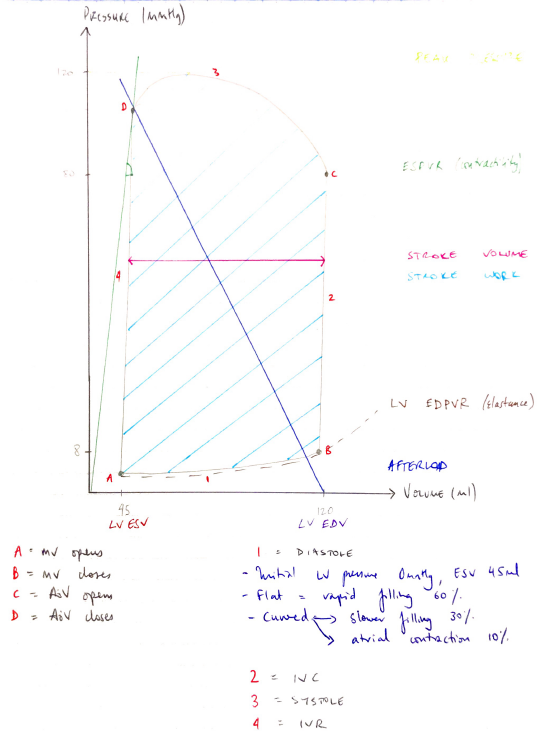
Draw and label a left ventricular pressure volume loop in a normal adult (40% of marks). List the information that can be obtained from this loop (60% of marks).
65% of candidates passed this question.
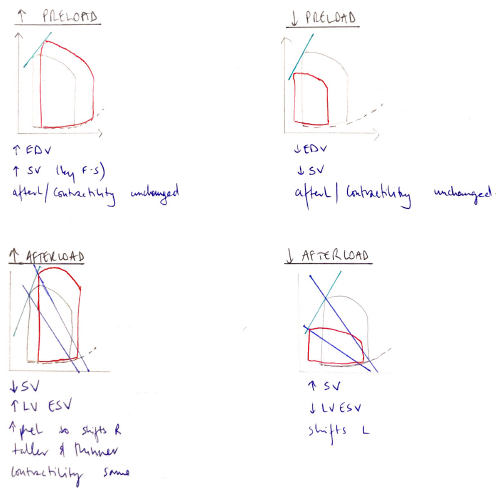
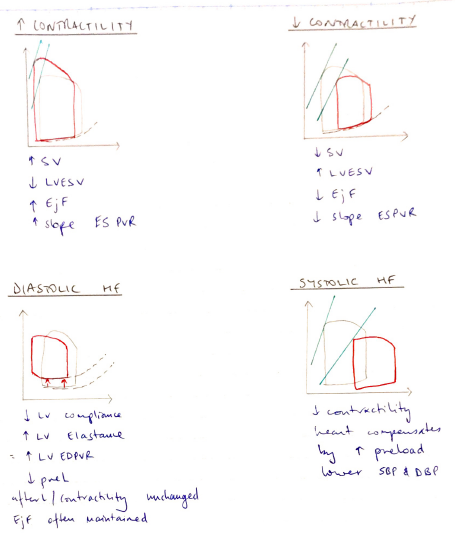
Many candidates lost marks for poor quality diagrams with inaccurate labelling. An accurate diagram was required. Many answers lacked sufficient detail regarding contractility and afterload.
G3vi / 17A23: Draw and label a LV pressure volume loop in a normal adult (40 marks). List information that can be obtained from this loop (60 marks)
Definition
A loop that depicts the changes in LV pressure & volume throughout the cardiac cycle
Construction
- Heart isolated in a lab
- Measure P changes for different volumes
- @SYSTOLE: measure P for different volumes during contraction whilst preventing outflow
- @DIASTOLE: gradually fill heart & measure P at each volume before contraction
- Plotted on P vs V to generate a loop

Information Obtained
Stroke Volume
- EDV – ESV
- ~70mL
Stroke Work
- Work = force x distance = pressure x volume
- ∴area inside PV loop is the external work performed by LV to expel blood for that cardiac cycle
LV EDV
- Represents preL
- ~120mL
LV ESV
- Implications for LAP
- ↑ESV = ↓gradient for blood to move from LA → LV
- ∴LA will require ↑P to move blood
Peak Pressure
- = SBP
- The maximum pressure achieved in systole
LV EDPVR (Elastance)
- Slope of line A → B
- Shows ELASTANCE (lusitropy) of ventricle
- Elastance = ∆P / ∆V
- Compliance may be inferred (1 / Elastance)
- Towards the end it curves up (1 compliance) because LV difficult to overfill. Sarcomere length cannot extend beyond 2.2µm
LV ESPVR
- Reflects CONTRACTILITY
- Starts just after 0mL
- Intersects D
- Straight line
- Intersects PEAK PRESSURE & C
- The angle it makes with C = CONTRACTILITY


