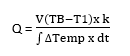
G6iii: Describe the principles & limitations of the measurement of cardiac output using PICCO
Definition
- PICCO = pulse contour cardiac output (acronym)
- PICCO = a CO monitor that combines pulse contour analysis & transpulmonary thermodilution technique
Use
- Haemodynamic monitoring of shock
- PAC unavailable/contraindicated
Contraindicated (inaccurate measurements)
- Intracardiac shunts
- Aortic aneurysm
- Aortic stenosis
- Pneumonectomy
- PE
- Balloon pump
- Unstable arrhythmias
Set Up/Insertion
- An arterial line with a Thermistor
- A pressure transducer
- A PICCO monitor
- Sterile, Seldinger technique
- Central line insertion
- Proximally placed PICCO cannula (femoral, brachial, axillary) to give a good dicrotic notch & arterial waveform
- PICCO then calibrated by thermodilution (like PAC) to calculate CO
- 15mL cold fluid bolus rapidly injected into CVC
- Thermistor in arterial line detects the ∆ in temperature
- ∴ in contrast with PAC, the fluid bolus passes through entire R) side circulation →ejected from LV →detected
- CO is then measured with the modified S-H equation:

Q = CO
V = volume of injectate
TB = temp blood
T1 = temp injectate
K = constant, which corrects for specific heat & density of inectate
dt = ∆ time
- This initial calibration sets parameters & then an algorithm computes each SV
SV ~ Area under Curve in systole – diastolic area
CO Then Derived = SV X HR
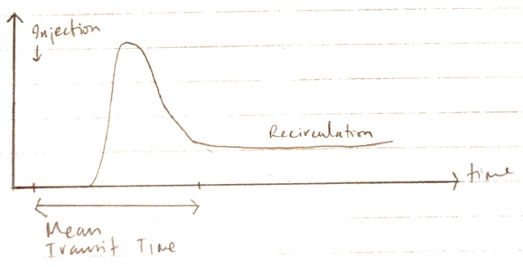
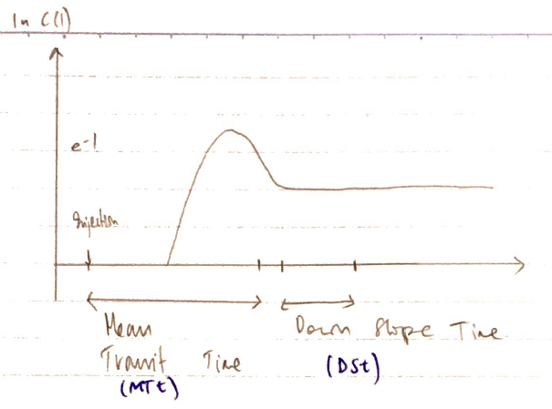
Transpulmonary Thermodilution
- All volume parameters are obtained from the thermodilution calibration above
- CO is calculated from AuC substitution into SH Equation
- CO x MTt = total volume traversed by indicator (from site of injection →site of detection)
- CO x DSt = volume of the largest mixing volume in a series
- Intrathoracic compartments are like a ‘series of mixing chambers’
- The largest mixing chamber is the lungs because the indicator (cold) has the largest VD here (largest thermal vol.)
- So the PTV can be calculated using the gradient of the washout curve
TTV = CO x MTt
Pulse Control Analysis
- Arterial pressure curve provides beat-by-beat SV & CO estimates
- SV ~ area under diastolic curve (minus diastolic area)
- SV x HR → CO
Parameters Derived
Thermodilution
Arterial Pulse Contour Analysis
CO 4 – 8L/min
CI →CO which is 3 – 5L/min corrected for BSA
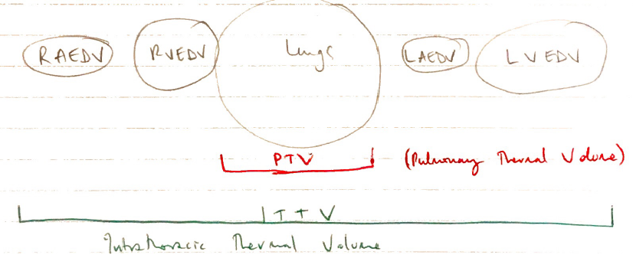
GEDV = RACDV + RVEDV + LAEDV + LVEDV
- 600 – 800mL/M2
- Essentially PRELOAD
- Does not relate well to fluid responsiveness
Global ejection fraction (25 – 35%)
- Radio of 4 stroke volumes divided by GEDV/detects ventricular dysfunction
Intrathoracic Blood Volume (ITBV)
- = GEDV + pulm. blood vol
- Volume in heart + volume in lungs
- ITBV1 = 850 – 1000mL/M2
Extravascular lung water (EVLW)
- Water content in lungs indicates permeability of pulm. vasculature
- ELWI 3 – 7mL/kg
→EVLWI = corrected for body weight =
3 – 7mL/kg
Pulse continuous CO
SV = 50 – 110mL
- Area under arterial pressure curve
SVI 40 – 60mL/M2
- SV adjusted for BSA
SVV (<10%)
- SVV = SVmax –
- Measures ‘swing in a line over 30 secs’
Any variation >10% warrants a fluid bolus
Advantages
- Good correlation with PAC thermodilution
- Does not require PAC
- Many variables derived
Disadvantages
- Requires CVC & Art. Line
- Requires regular calibration
- Regular + accurate BP transduction →system v. sensitive to Damping