Describe the effects of V/Q inequality on the partial pressure of oxygen (PaO2) and carbon dioxide (PaCO2) in arterial blood.
8% of candidates passed this question.
Very few candidates demonstrated understanding of this core topic. Candidates did not accurately define V/Q inequality and the physiological factors causing this phenomenon. V/Q scatter as well as true shunt (V/Q=0) and dead space (V/Q=∞) needed to be considered. The inability of high V/Q areas to compensate for low V/Q zones owing to the relatively small contribution of blood flow from these high V/Q units was not discussed. The differential effect of FiO2 on true shunt versus V/Q scatter was seldom explained. The shape of the oxy-Hb dissociation curve and CO2-dissociation curve were sometimes mentioned but their effect on arterial gas tensions not well explained.
Often graphs were reproduced inaccurately and contradictory statements made, leaving the impression that candidates did not understand the basic concepts. It is core knowledge for Intensive Care Specialists managing respiratory failure. A sophisticated knowledge based on the chapter in Nunn is a minimum standard expected for this topic.
F6viii / 14B05: Describe the effects of V/Q inequality on the partial pressure of oxygen (PaO2) and carbon dioxide (PaCO2) in arterial blood
Tips
Use dot points and shorthand – these explanation questions can get wordy
Practice explaining verbally – helps ensure you understand
Key parts to mention are given by the examiner report
Can also explain this in terms of West zones if this is a more familiar structure
Many graphs are relevant here but consider if they duplicate what you are already saying in words or if they add information
V/Q = Ventilation-Perfusion Ratio
⦁ Normal ventilation ~5L/min (500ml tidal volume x 10 breaths/min) ⦁ Normal perfusion ~5L/min (70ml stroke volume x 70 heart beats/min)
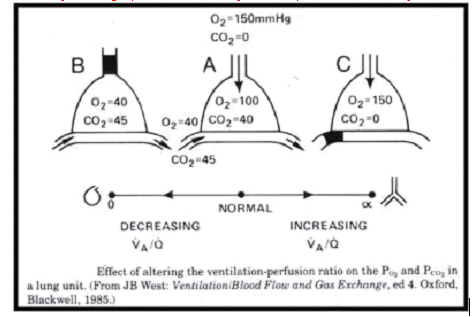
→ V/Q=1 is an "ideal" lung unit with perfectly matched ventilation and perfusion
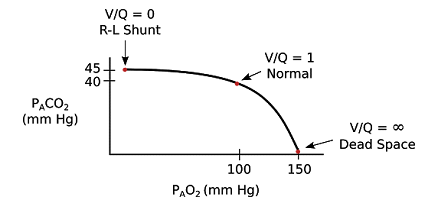
⦁ PaO2 and PaCO2 should approach PaO2 = 100, PaCO2 = 40
→ V/Q=0 is true shunt with blood passing through with no oxygenation or CO2 removal
PaO2 and PaCO2 will be those of venous blood ie PaO2 = 40, PaCO2 = 45
V/Q between 0 and 1 will approach venous O2 to varying extents
Causes of shunt or V/Q<1
Pulmonary congestion – pneumonia, oedema
Pulmonary collapse – atelectasis
AVM
→ V/Q=infinity is true alveolar dead space with ventilated lung units that receive no blood supply
There is no blood past these lung units so no PaO2 or PaCO2 to describe
Causes for alveolar dead space or V/Q>1
Poor perfusion – low cardiac output, PE
Hyperexpansion causing West zone 1 – eg COPD, excess PEEP
Parenchymal lung disease – emphysema causing nonperfused pockets of lung
Between V/Q of 1 and infinity, there is significant ventilation for the blood that passes through and PaO2 and PaCO2 will approach those of alveolar gas ie PaO2 = 150, PaCO2 = 0
Either of these graphs can be a useful to help remove some of the words above
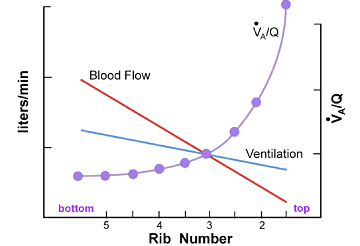
If pressed for time the explanation of physiological V/Q scatter can be shortened – using the graph below can help remove a lot of the words
Normal lung has an increasing V/Q gradient from base to apex in the erect lung
Perfusion is higher at the base due to the effect of gravity on blood flow (harder to pump blood up against gravity)
Ventilation is greater at the base due to gravity and mass of mediastinum/abdominal viscera causing a more negative intrapleural pressure compared to the apex alveoli are less expanded before inspiration and at a more optimal part of the compliance curve so receive more ventilation compared to the more expanded apical alveoli
The perfusion gradient is greater than the ventilation gradient so there is lower V/Q at the base
V/Q > 1 above rib 3 (2pprox. 3.0 at apex)
V/Q = 1 at 2pprox. 3rd rib
V/Q <1 below rib 3 (2pprox. 0.6 at bases)
Make sure you leave time to mention this part:
V/Q inequality leads to a mix of lung regions with V/Q >1 and V/Q <1.
Causes
Physiological – as above
Posture – more scatter upright > supine > prone
Any regional cause of V/Q >1 or V/Q <1 as above
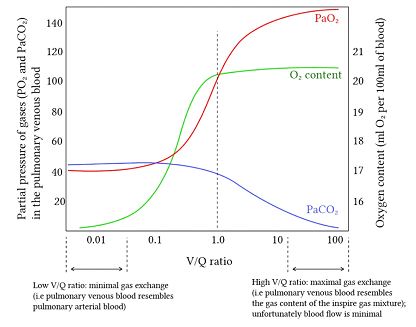
Regions with V/Q <1 receive most of the blood supply and therefore contribute the greatest amount to the resulting mixed arterial PaO2 and PaCO2.
V/Q <1 are regions with lower ventilation where PaO2 and PaCO2 approach those of venous blood ie PaO2 = 40, PaCO2 = 45
Therefore high V/Q scatter/inequality leads to decreased O2 and increased CO2.
This can be overcome by increased ventilation for CO2 since CO2 diffusion is faster, and there is a linear O2 carriage relationship for CO2. CO2 elevation is also rapidly detected by the peripheral chemoreceptors and results in increased minute ventilation.
The Hb-O2 dissociation curve is non-linear so there is minimal change in PaO2 from increased ventilation
The effect on PaO2 can be reversed by giving supplemental O2 unless there is significant true shunt (V/Q=0), in which case there will be minimal improvement from higher FiO2.
I would not include this graph, it adds little. Included for reference of the concept rather than as a suggestion to draw it