G4vii / 17A19: Define mixed venous PO2 (20% of marks). Outline the factors that affect this value (80% of marks)
17A19: Exam Report
Define mixed venous PO2 (20% of marks). Outline the factors that affect this value (80% of marks).
37% of candidates passed this question.
This question was in two parts – the first part was worth 20% and candidates were expected to provide a definition of mixed venous blood as well as the partial pressure of oxygen in mixed venous blood (including normal range). Good answers also provided the varying PO2 from different tissue beds that make up mixed venous blood, where the ‘mixing’ occurs (the right
ventricle) and where it is sampled (pulmonary artery).
For the second part of the question, worth 80% of the marks, good answers included the relationship between mixed venous PO2 and mixed venous O2 content (including the shape and position of the HbO2 dissociation curve); the variables encompassed in the modified Fick equation; arterial oxygen content and its determinants; oxygen consumption (VO2); and cardiac output (CO). Including an outline of how each affects the value of mixed venous PO2.
A number of candidates wrote about mixed venous oxygen saturation. Other common errors were: missing a number of key factors that affect PO2; and using an incorrect form and/or content of the modified Fick equation.
G4vii / 17A19: Define mixed venous PO2 (20% of marks). Outline the factors that affect this value (80% of marks)
Definition
Mixed venous partial pressure of O2 (PvO2): The partial pressure of oxygen in mixed venous blood taken from the pulmonary artery using a PAC. Blood is “mixed” in the right ventricle and is representative of blood from the whole body (including the coronary sinus).
Normal range: 35-45mmHg (typically ~40mmHg)
Contribution from Various Tissue Beds
- Some tissues consume more oxygen than others
- Due to different tissues oxygen extraction ratios (OERs)
- Results in differences in SO2 (Hb saturation) and PO2 in venous blood:
- Blood in the SVC: SvO2 ~70% (PvO2 ~40mmHg)
- Blood in the IVC: SvO2 ~75-80% (PvO2 ~45mmHg)
- Blood from the coronary sinus: SvO2 ~37% (PvO2 ~22mmHg)
Factors that Affect PvO2
- O2 content of mixed venous blood
- Oxygen Dissociation Curve
O2 Content of Mixed Venous Blood (CvO2)
Can be explained using the Modified Fick Equation
- VO2 = CO(CaO2 – CvO2)
- \( \text{CvO2 = CaO2 – } \frac{\text{ VO2 }}{\text{CO}} \)
Therefore, CvO2 is further influenced by:
- Cardiac Output – increased CO -> ↑CvO2 -> ↑ PvO2
- If CO decreases, capillary blood flow slows and more O2 is extracted from each mL of blood to maintain O2 delivery to the tissues.
- VO2 (O2 consumption) – increased VO2 -> ↓ CvO2 -> ↓ PvO2
- Oxygen is consumed in the process of aerobic metabolism – acts as the terminal electron acceptor in the mitochondrial electron transport chain -> forms H2O
- VO2 is the rate the tissues are able to utilise O2
Factors increasing VO2:
- Exercise
- Fever/hyperthermia
- Increased metabolic demand
Factors decreasing VO2:
- Anaesthesia/sedation
- Paralysis
- Cooling
- Mitochondrial dysfunction preventing O2 utilisation (e.g. cyanide poisoning)
- CaO2 (arterial O2 content) – increased CaO2 -> ↑ CvO2 -> ↑ PvO2
- If Ca O2 is low, and VO2/demand is unchanged, then it follows that CvO2 will be low
- CaO2 (in mL/L) = (1.34 x [Hb] x SaO2) + (0.03 x PaO2)
- Causes of hypoxaemia (low CaO2):
- Decreased PAO2
- Alveolar diffusion impairment
- V/Q mismatch
- Low CvO2 – the O2 entering the blood is added to the CvO2
- Anaemia
- Causes of increased CaO2:
- High FiO2 – small effect once SaO2 100%
- Hyperbaric hyperoxia – PaO2 can be very high
The O2-Hb Dissociation Curve
There is a non-linear relationship between blood oxygen content and partial pressure of oxygen – this is almost completely determined by the binding of oxygen to Hb (as CaCO2 = (1.34 x SO2 x [Hb]) + (0.003 x pO2)), and Hb saturation is in turn largely determined by the pO2.
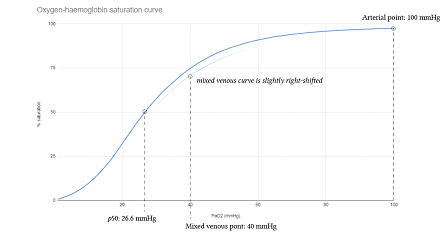
- O2-Hb binding is described by the O2-Hb dissociation curve.
- Refrence
Shape
The curve is sigmoid shaped due to:
- Cooperative binding – Hb molecules exhibit cooperative binding, whereby the binding of 1 O2 molecule makes it easier for subsequent molecules to bind.
- Allosteric modulators (e.g. temperature, pCO2, pH and 2,3-DPG concentration) – have a role in altering the shape of the curve.
Position
- Allosteric modulators – the above factors also shift the curve left or right
- Factors causing a right shift:
- Increased pCO2
- Decreased pH
- Increased 2,3-DPG concentration
- Increased temperature
- The mixed venous curve is right shifted compared with the arterial curve due to ↑ pCO2 and ↓ pH
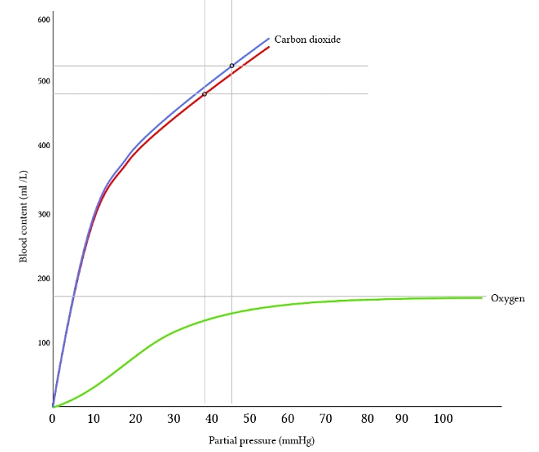
The relationship between pO2 and oxygen content (for a given Hb concentration) can also be graphed directly:
Author: Joshua McLarty